Multi-page report: source and rendered PDF
Playground/7.2 ms on Apple M4 Pro, at buildRendered at build · 7.2 ms on Apple M4 Pro · 3 pages · 38.5 KiB
report.tsx
import { realpathSync } from 'node:fs';

import {
  Cell,
  Document,
  Footer,
  Header,
  Page,
  PageNumber,
  Rect,
  Row,
  renderToFile,
  Svg,
  Table,
  Text,
  TotalPages,
  View,
} from '@inkoxide/render';

interface Sale {
  region: string;
  manager: string;
  units: number;
  revenue: number;
  growth: number;
}

export interface ReportProps {
  quarter: string;
  monthly: { month: string; revenue: number }[];
  sales: Sale[];
}

const usd = (n: number) =>
  n.toLocaleString('en-US', { style: 'currency', currency: 'USD', maximumFractionDigits: 0 });

function Kpi({ label, value, note }: { label: string; value: string; note: string }) {
  return (
    <View className="flex-1 rounded-lg border border-gray-200 p-4">
      <Text className="text-[7.5pt] font-bold uppercase tracking-wider text-gray-500">{label}</Text>
      <Text className="mt-1 text-xl font-bold">{value}</Text>
      <Text className="text-emerald-600">{note}</Text>
    </View>
  );
}

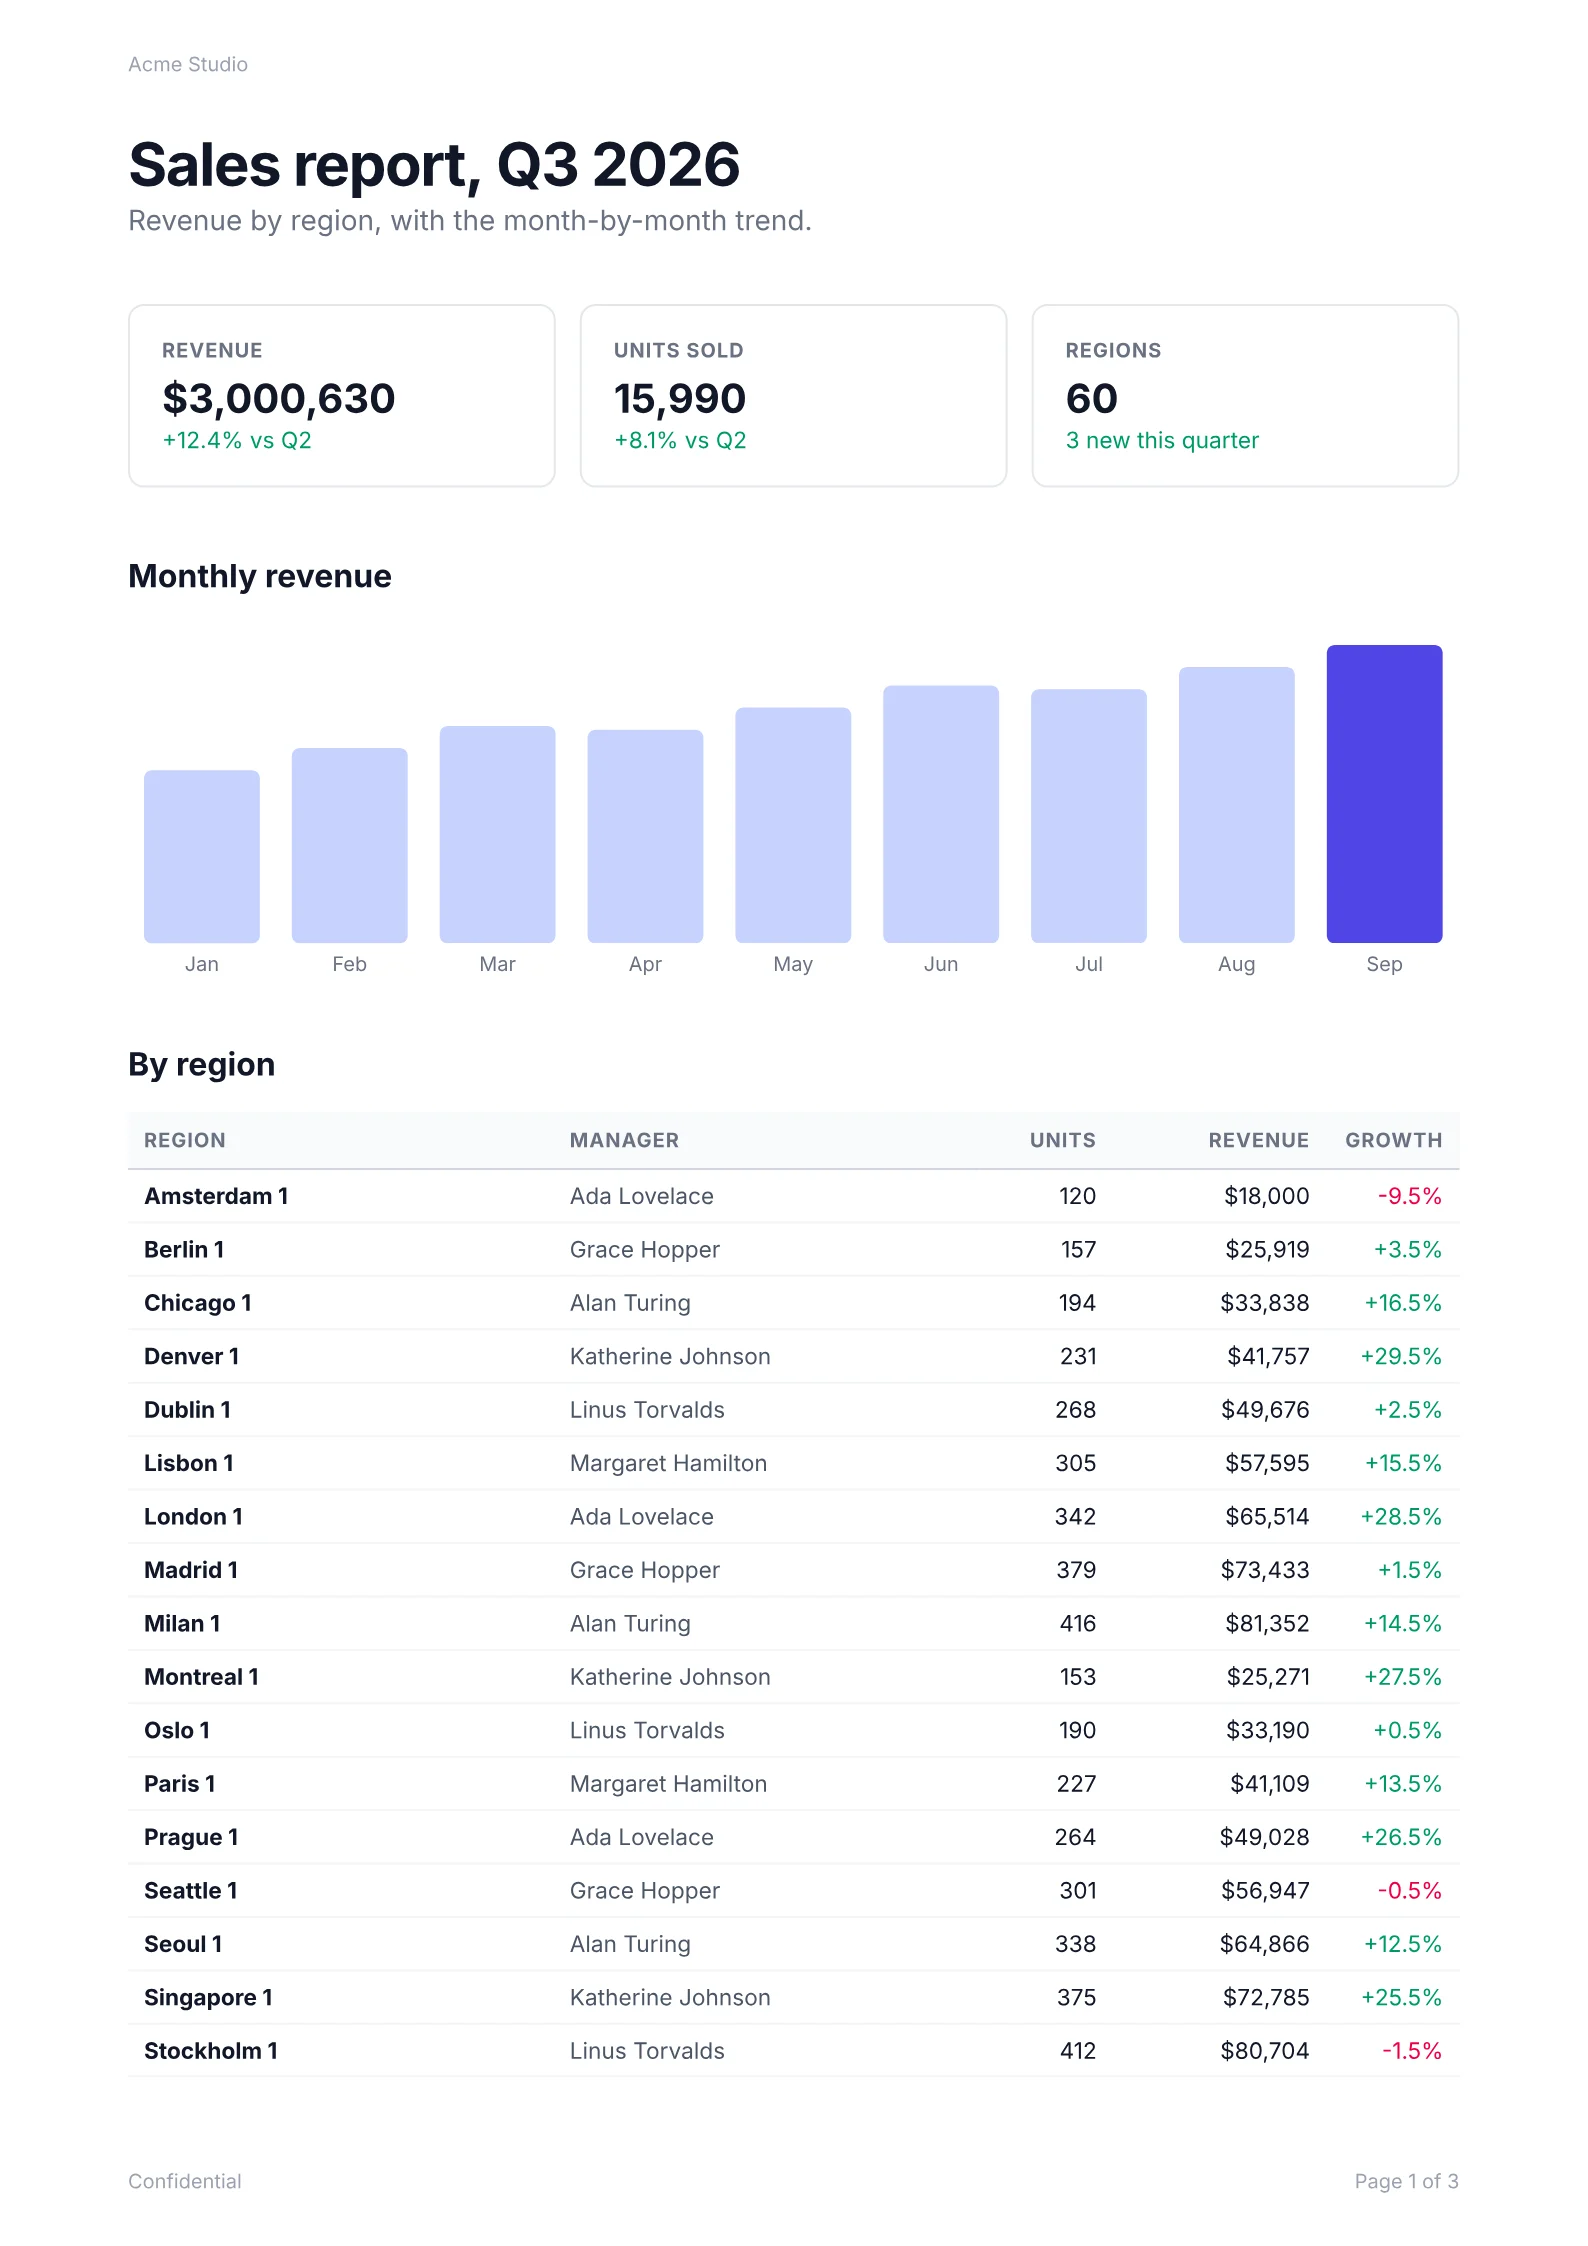
/** A bar chart drawn with SVG primitives. */
function Chart({ data }: { data: ReportProps['monthly'] }) {
  const max = Math.max(...data.map((d) => d.revenue));
  const w = 499; // the content width: A4 (595pt) minus the 48pt margins
  const h = 120;
  const bar = w / data.length;
  return (
    <View className="mb-8">
      <Svg width={w} height={h} viewBox={`0 0 ${w} ${h}`}>
        {data.map((d, i) => {
          const bh = (d.revenue / max) * (h - 8);
          return (
            <Rect
              key={d.month}
              x={i * bar + 6}
              y={h - bh}
              width={bar - 12}
              height={bh}
              rx={3}
              fill={i === data.length - 1 ? '#4f46e5' : '#c7d2fe'}
            />
          );
        })}
      </Svg>
      <View className="mt-1 flex-row" style={{ width: w }}>
        {data.map((d) => (
          <Text key={d.month} className="flex-1 text-center text-[7.5pt] text-gray-500">
            {d.month}
          </Text>
        ))}
      </View>
    </View>
  );
}

export default function Report({ quarter, monthly, sales }: ReportProps) {
  const revenue = sales.reduce((sum, s) => sum + s.revenue, 0);
  const units = sales.reduce((sum, s) => sum + s.units, 0);
  const th =
    'border-b border-gray-300 bg-gray-50 px-2 py-2 text-[7.5pt] font-bold uppercase tracking-wider text-gray-500';
  const td = 'border-b border-gray-100 px-2 py-1.5';

  return (
    <Document title={`Sales report ${quarter}`} author="Acme Studio">
      <Page size="A4" className="p-16 text-[8.5pt] text-gray-900">
        <Header className="flex-row justify-between text-[7.5pt] text-gray-400">
          <Text>Acme Studio</Text>
          <Text pages="notFirst">Sales report · {quarter}</Text>
        </Header>
        <Footer className="flex-row justify-between text-[7.5pt] text-gray-400">
          <Text>Confidential</Text>
          <Text className="text-right">
            Page <PageNumber /> of <TotalPages />
          </Text>
        </Footer>

        <Text className="text-3xl font-bold tracking-tight">Sales report, {quarter}</Text>
        <Text className="mb-8 text-sm text-gray-500">Revenue by region, with the month-by-month trend.</Text>

        <View className="mb-8 flex-row gap-3">
          <Kpi label="Revenue" value={usd(revenue)} note="+12.4% vs Q2" />
          <Kpi label="Units sold" value={units.toLocaleString('en-US')} note="+8.1% vs Q2" />
          <Kpi label="Regions" value={String(sales.length)} note="3 new this quarter" />
        </View>

        <Text className="mb-3 text-base font-bold" bookmark="Monthly revenue">
          Monthly revenue
        </Text>
        <Chart data={monthly} />

        <Text className="mb-3 text-base font-bold" bookmark="By region" break={{ minPresenceAhead: 120 }}>
          By region
        </Text>
        <Table columns={['1fr', '1fr', 50, 80, 50]} headerRows={1}>
          <Row>
            <Cell className={th}>Region</Cell>
            <Cell className={th}>Manager</Cell>
            <Cell className={`${th} text-right`}>Units</Cell>
            <Cell className={`${th} text-right`}>Revenue</Cell>
            <Cell className={`${th} text-right`}>Growth</Cell>
          </Row>
          {sales.map((s) => (
            <Row key={s.region}>
              <Cell className={`${td} font-bold`}>{s.region}</Cell>
              <Cell className={`${td} text-gray-600`}>{s.manager}</Cell>
              <Cell className={`${td} text-right`}>{s.units}</Cell>
              <Cell className={`${td} text-right`}>{usd(s.revenue)}</Cell>
              <Cell className={`${td} text-right ${s.growth < 0 ? 'text-rose-600' : 'text-emerald-600'}`}>
                {s.growth > 0 ? '+' : ''}
                {s.growth.toFixed(1)}%
              </Cell>
            </Row>
          ))}
        </Table>
      </Page>
    </Document>
  );
}

const cities = [
  'Amsterdam',
  'Berlin',
  'Chicago',
  'Denver',
  'Dublin',
  'Lisbon',
  'London',
  'Madrid',
  'Milan',
  'Montreal',
  'Oslo',
  'Paris',
  'Prague',
  'Seattle',
  'Seoul',
  'Singapore',
  'Stockholm',
  'Sydney',
  'Tokyo',
  'Toronto',
  'Vienna',
  'Warsaw',
  'Zurich',
];
const managers = [
  'Ada Lovelace',
  'Grace Hopper',
  'Alan Turing',
  'Katherine Johnson',
  'Linus Torvalds',
  'Margaret Hamilton',
];

export const sample: ReportProps = {
  quarter: 'Q3 2026',
  monthly: ['Jan', 'Feb', 'Mar', 'Apr', 'May', 'Jun', 'Jul', 'Aug', 'Sep'].map((month, i) => ({
    month,
    revenue: 180_000 + i * 14_000 + (i % 3) * 9_000,
  })),
  sales: Array.from({ length: 60 }, (_, i) => ({
    region: `${cities[i % cities.length]} ${Math.floor(i / cities.length) + 1}`,
    manager: managers[i % managers.length] as string,
    units: 120 + ((i * 37) % 300),
    revenue: 18_000 + ((i * 7_919) % 64_000),
    growth: ((i * 13) % 40) - 9.5,
  })),
};

if (process.argv[1] && realpathSync(process.argv[1]) === import.meta.filename)
  await renderToFile(<Report {...sample} />, 'report.pdf');
Edit the source and the PDF renders again, in this browser: the engine runs as WebAssembly in a Web Worker. How it works
report.pdf
7.2 ms on Apple M4 Pro, at buildRendered at build · 7.2 ms on Apple M4 Pro · 3 pages · 38.5 KiB
Page 1 / 3